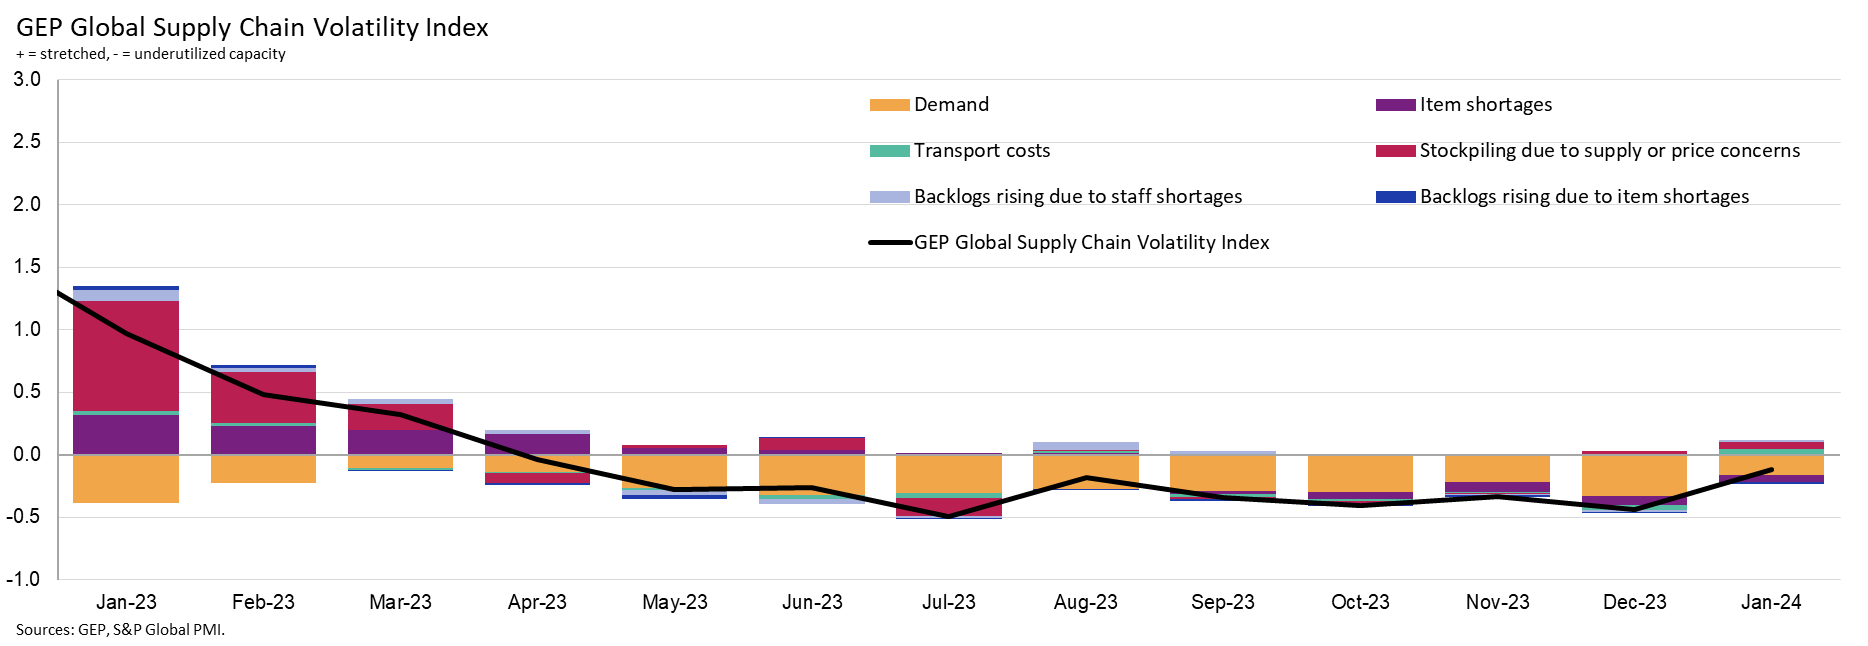
The GEP Global Supply Chain Volatility Index — a leading indicator tracking demand conditions, shortages, transportation costs, inventories and backlogs based on a monthly survey of 27,000 businesses — rose to -0.12 in January, from -0.44 in December, its highest level since last April, indicating that spare capacity across global supply chains has shrunk notably.
More from GEP & the demand for raw materials in our February edition. Read the full article here!
Although this is the ninth successive month of excess capacity at global suppliers, the downturn eased to its weakest since last April. The index suggests that underlying trading conditions may be starting to improve as recession and inflation fears fade and businesses prepare for a stronger 2024.
The most noteworthy impact from the Red Sea disruption was to transportation costs, which rose to a 15-month high in January, as commercial ships took the lengthier route around the Cape of Good Hope. There was also a slight pick-up in safety stockpiling, with reports from businesses of inventory building due to supply or price fears at the highest since last June. That said, they were well below the levels seen in 2021-2022 during the post-pandemic supply crunch.
Regionally, Asia’s supply chains were at their busiest in nearly a year as factory purchasing activity in China, South Korea and India rebounded, suggesting manufacturers there are gearing up for growth. In a similar vein, suppliers to North America and Europe saw their spare capacity shrink during January. Less slack was also seen for the U.K.’s suppliers, who have experienced subdued demand for 19 consecutive months.
“The world’s supply chains got busier in January, and activity at our global manufacturing clients is ticking up,” explained Daryl Watkins, senior director, consulting, GEP.
“With input demand trending higher, led by Asia, signalling a return to positive growth in the coming months, it is imperative business keeps tamping down suppliers’ price increases so inflation continues to trend down,” said Watkins, summarizing the implications.
Interpreting the data:
- Index > 0, supply chain capacity is being stretched. The further above 0, the more stretched supply chains are.
- Index < 0, supply chain capacity is being underutilized. The further below 0, the more underutilized supply chains are.
| JANUARY 2024 KEY FINDINGSDEMAND: Purchases of raw materials, commodities and components remained subdued, although the decline eased to its weakest since last April, hinting at improving demand. INVENTORIES: Reports of safety stockpiling due to supply or price concerns ticked up to a seven-month high in January as disruption through the Suez Canal led some companies to build up inventory buffers. MATERIAL SHORTAGES: Global supply conditions remain healthy — reports of item shortages remain among the lowest seen in four years. LABOR SHORTAGES: Labor availability remains unproblematic for global suppliers, with reports of backlogs rising due to a lack of staff holding close to historically typical levels. TRANSPORTATION: Global transportation costs rose to a 15-month high in January, signalling some contagion from the disruption to shipping through the Suez Canal. REGIONAL SUPPLY CHAIN VOLATILITYNORTH AMERICA: Index rose to -0.33, from -0.39, indicating the 10th consecutive month of underutilized supplier capacity.EUROPE: Index rose to -0.63, from -0.92, the lowest level of excess vendor capacity in five months. U.K.: Index rose to -0.62, from -1.05, showing spare capacity at U.K. suppliers almost halving, which is a positive sign after 19 consecutive months of subdued input demand. ASIA: Index rose to 0.14, from -0.42, indicating the strongest pressure on the region’s supply chains in almost a year amid improving demand in key exporting nations. |